
 |
|||||||||||||||
 |
|||||||||||||||
Results up-dates
A) A short summary report of findings for England and selected figures is available for download - click here (pdf)
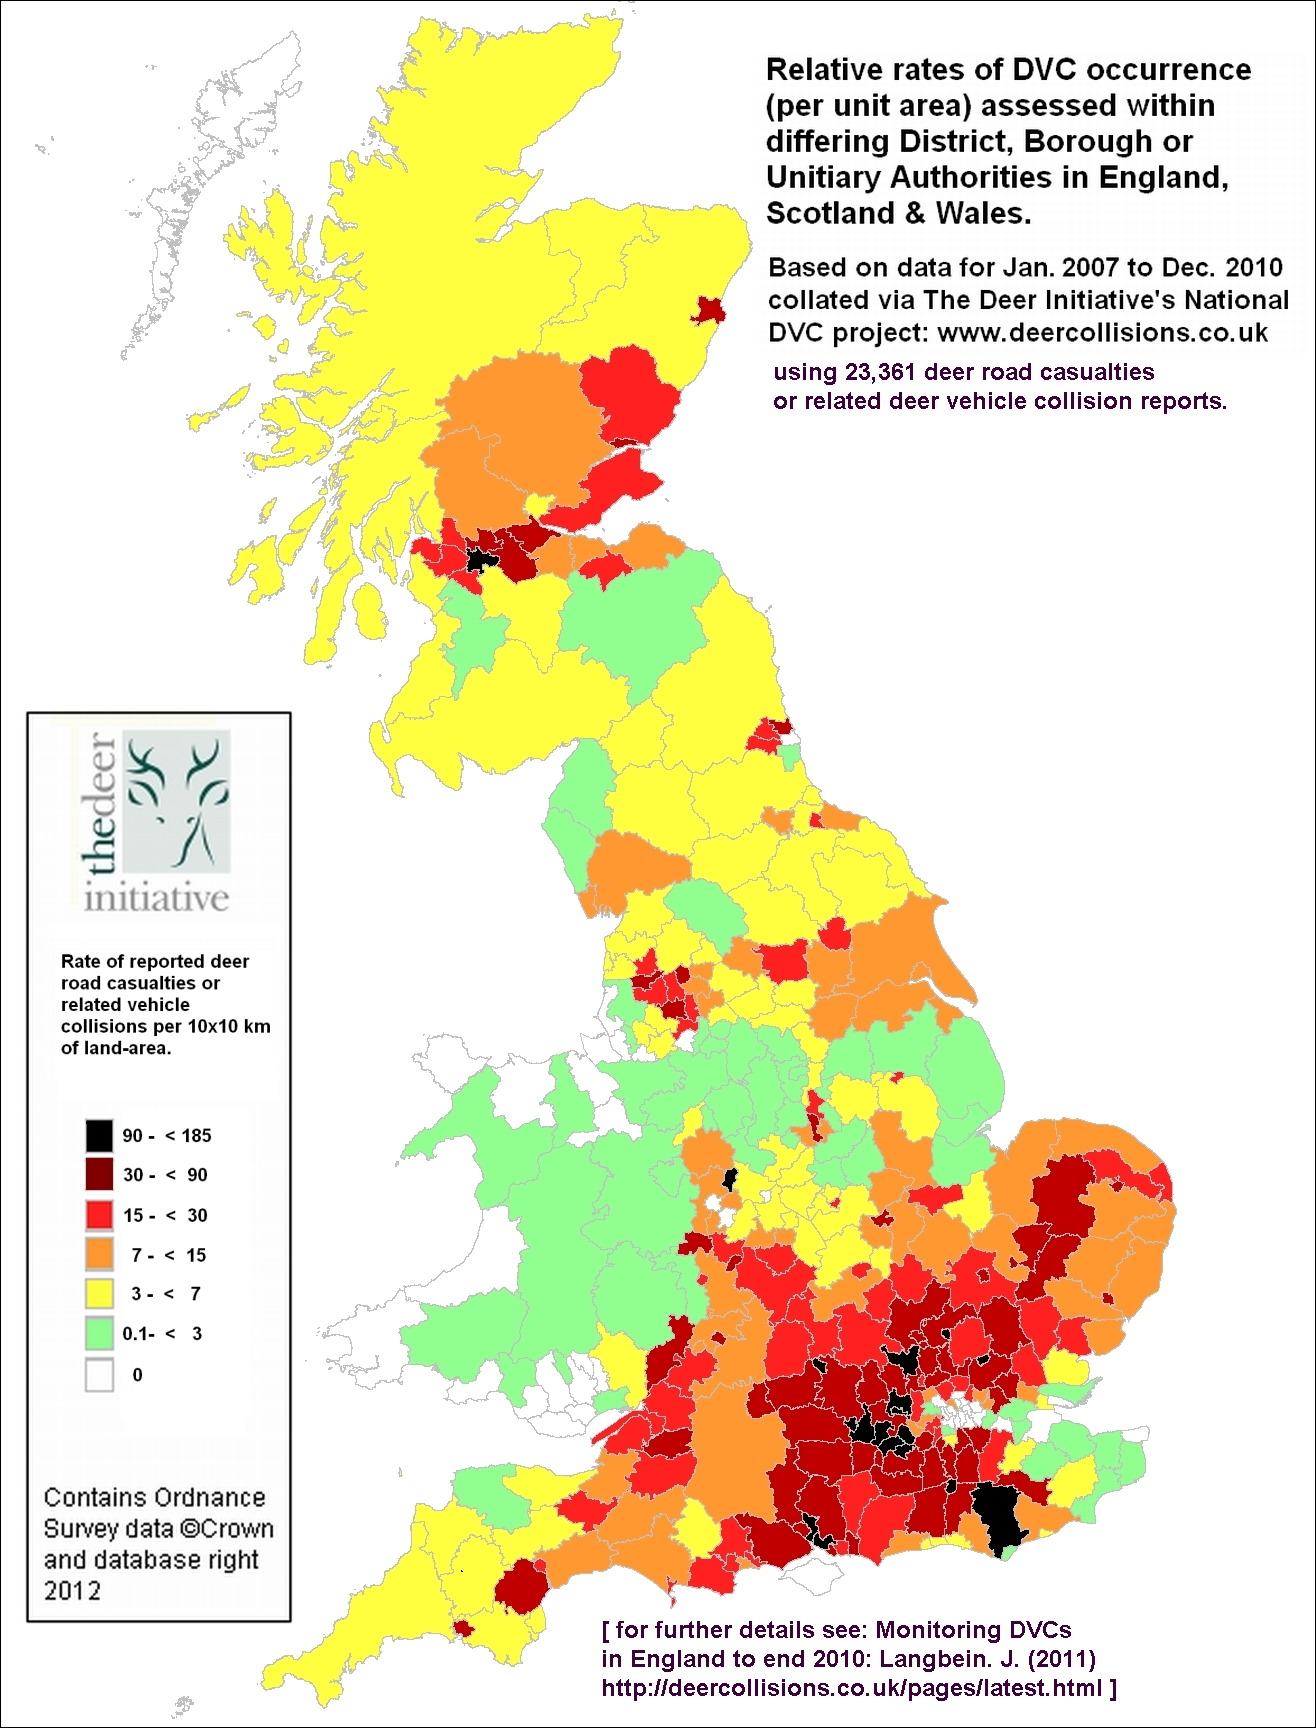
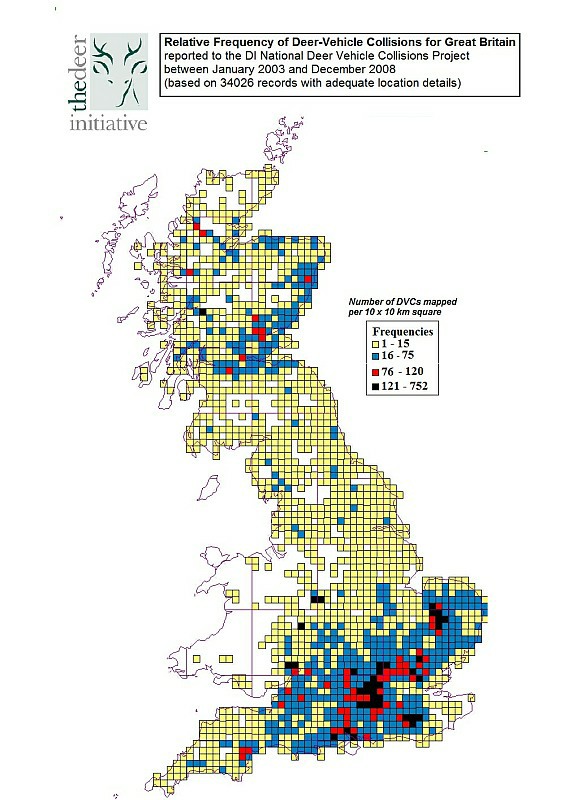
B) For a visual GB wide overview of relative rate of reported deer road casualties or related deer-vehicle collsions per unit AREA in differing Local authorities click images below, based on data for:
(left) 2007-2010 (right) 2003-2006
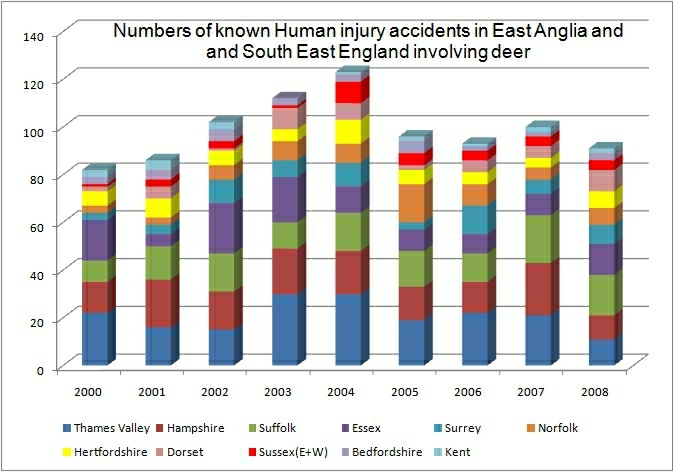
c) Graph below gives comparison of numbers of DVC leading to reported HUMAN injuries traffic accidents in Southeast and East of England. (for fuller detail see main DVC-England report)
D) For Regional DVC Distribution Maps (by Trunk road Managment Areas - England) click here.
E) For Regional DVC Maps in Scotland click here (download pdf 17 MB).
Further results see fuller research report links on Publications page]